The following is a direct copy and has been Pasted in for future reference from the People & Place coursework PDF Doc. (pasted in Maroon)
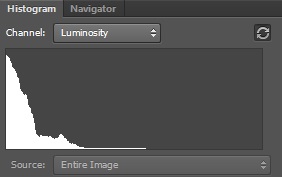
The purpose of this exercise is to increase your familiarity with histograms by relating each one to the image you have just shot. This is not intended as an in depth analysis, but rather an aid to recognising the most basic characteristics of an image. Histograms appear twice in a normal workflow – the first time on the camera’s LCD screen, the second when the image is being processed – and it is valuable to make use of both occasions.
You will need to find and shoot the three most basic categories of scene by contrast. These are low-contrast (that is, flat in appearance, with a low dynamic range), average contrast, and high contrast (with a dynamic range greater than that of the camera). Then, for each of these picture situations, shoot not only an averagely exposed version, but also one that is approximately one f-stop darker and another that is approximately one f-stop brighter. This makes nine images in all by the time you have finished.
As you shoot, make a point of checking the histogram as it appears on the camera’s LCD screen, if your camera has this facility. Note that if you are shooting raw, this small histogram is actually taken not from the raw file itself, which would delay shooting, but from a JPEG, so there may be a slight difference from the next time you see the histogram on the computer.
The lower the contrast (the ‘flatter’), the more the values are squeezed together in the histogram, whereas a high-contrast image will be spread right across the histogram, right up to the edges. Varying the exposure will shift the bulk of the values either left (with under-exposure) or right (with over-exposure). (See the examples at the start of Part Two.)
Now open and examine each image in Photoshop or whatever processing software you use, and make sure that the histogram is displayed. You should also make sure that the highlight and shadow clipping warnings are also displayed.
Make a screenshot of each histogram and save with each image; alternatively, make a sketch of each histogram on paper. Write a short note for each image + histogram with your explanation of how they relate and how exactly they vary with exposure. Make a special note of the occasions on which highlight and shadow clipping occur, and whether one is greater than the other.
– – – – – – – – – – – – – – – – – – – – – – – – – – – – – – – – – – – – – – – – – – – – – – – – – – – – – – – – –
Equipment
Camera – Nikon D4
Lenses – 24/70 – f2.8 & 80/400 – f4.5 – 5.6 (prime)
Ancillary Equipment – Tripod
Method & Approach
Please see pictures and captions below.
All pictures have been compressed hence there might be a quality reduction when enlarging.
1. Histogram – High Contrast
Shown below are three identical pictures, there only difference is exposure.
All picture sequences (shown below) follow the same format and are grouped identically for each histogram instance. The first image shown in the sequence is a view on the rear of the cameras ‘on board’ histogram, the second is a view of the same picture but opened in Adobe RAW and finally the third picture is as viewed when opened in Photoshop. The pictures shown below have not been tweaked or edited in anyway, this has been done deliberately to keep the visual characteristics of each histogram as pure as possible. To visually help, I have enlarged each histogram below its above and corresponding image.
Picture Sequence – 1a
One ‘f-stop’ below normal exposure
Comments – Shown above is a ‘High Contrast’ image and in thought prior to and also whilst taking this picture, I have deliberately tried to capture detail outside of the cameras sensor range. Looking at the histogram along the ‘X axis’ we can see that the captured data to both the far left and far right goes outside of the histograms scale, thus meaning the data captured by the cameras sensor is less than the visual data available at the time of capture. With regards to exposure settings for this image, the camera was set up to expose one ‘f-stop’ below normal exposure (using the cameras onboard light meter).
Picture Sequence – 1b
Normal exposure
Comments – This time looking at the histogram the ‘X axis’ shows us that the captured data to the left is within the histograms scale but to the right the data is outside. This time the camera has managed to capture more data from the Black and Lower tones but has failed to capture the full data spectrum to the right in the Lighter and White tones. With regards to exposure settings for this image, the camera was set up to expose correctly (using the cameras onboard light meter).
Picture Sequence – 1c
One ‘f-stop’ above normal exposure
Comments – The histogram shown in this sequence is dramatically different from the two exposures above. Upon opening the RAW file we can immediately see that the highlight clipping warning (in red) has indicated parts of the image are beyond their respective maximum RGB (Red / Blue / Green) 255 intensities. With this in mind and again looking at the histograms ‘X axis’ we can see the data to the far right goes beyond the scale, indicating that the full amount of picture detail taken at the time (with this exposure) was beyond the cameras sensor range. But on the other side of the scale we see that the Black and Lower tones have all been captured and looking at the image we can visually see more detail in the berries and leaves, i.e. the dark tones are much clearer and more visible. With regards to the cameras exposure settings, the camera was set up to over expose this image by one ‘f-stop’ (using the cameras onboard light meter).
2. Histogram – Average Contrast
Picture Sequence – 2a
One ‘f-stop’ below normal exposure
Comments – The image shown here is typically an average contrast picture. I have deliberately framed this picture to capture a tiny portion of sky and admittedly for this part of the exercise I could have framed the picture not to include the sky (top left corner) and this would have given a histogram representing the full spectrum captured. But in essence to prove dark tones / mid tones and white tones visible within the histograms range I wanted to show just the tiniest portion of white tones (the sky) to prove that the histogram does in fact show us this. Also in this sequence of images the camera histogram is of a different shape to the RAW and Photoshop variants, we can see that the camera has captured a large amount of blue tones but we are unable to see this from purely looking at the cameras onboard histogram. With regards to exposure settings for this image, the camera was set up to expose one ‘f-stop’ below normal exposure (using the cameras onboard light meter).
Picture Sequence – 2b
Normal exposure
Comments – Moving on from the image taken above at one ‘f-stop’ below we can see that the histogram in this sequence is very central, it has effectively shifted across to the left and with it captured more detail in the mid tones. Again like the sequence of histograms shown in 2a the dark tones captured (blue) are only visible in RAW and Photoshop, looking further at these two software derived histograms it would seem that the camera histogram is very similar in shape to that of the red tones from the RAW and Photoshop variants, especially the histogram shown in Photoshop. With regards to exposure settings for this image, the camera was set up to expose correctly (using the cameras onboard light meter).
Picture Sequence – 2c
One ‘f-stop’ above normal exposure
Comments – Again like the histogram above (shown in sequence 1c) over exposing has created a totally different shape to that of the two previous shots representing Normal and Under Exposed characteristics. Opening the RAW file we see the highlight clipping warning once again, indicating the data recorded in some areas of this image is beyond maximum RGB intensity. In relevance of my initial thoughts when taking this picture … to include some of the sky, has not only proved we see the ‘White Tones’ in the histogram but also brings to life the offending area in the RAW image by highlighting it in red, thus visually showing us the over exposed location in the actual image. Also on the other side of the scale we see that Black and Lower Tones have not been captured to their full colour and tonal potentials. With regards to the cameras exposure settings, the camera was set up to over expose this image by one ‘f-stop’ (using the cameras onboard light meter).
3. Histogram – Low Contrast
Picture Sequence – 3a
One ‘f-stop’ below normal exposure
Comments – The portrait sequence shown here is of a Low Contrast Exposure and looking at the histogram we can immediately see why from the lack of pixel data. The image is of a helicopter flying overhead and is almost a silhouette which represents the Dark Tones on the far left of the histogram. The three coloured spikes represent sky colour and are made up from three independent RGB colours (as we can see) and in proof of this when looking at the RAW image, when I moused over the sky in the image the relevant tonal values were between 140 and 158, if we put this into context with the full scale of RGB tonal colours, i.e. from 0 to 255 we can now see that the above values fit exactly in the middle of the histogram for this exposure. With regards to exposure settings for this image, the camera was set up to expose one ‘f-stop’ below normal exposure (using the cameras onboard light meter).
Picture Sequence – 3b
Normal exposure
Comments – Looking at this ‘Normal Exposure’ we see that the histogram in this sequence has moved once again to the left but unlike the above pictures it has not captured any more detail in any of its neighbouring tones and it has also remained visually consistent to the Under Exposed characteristics. With regards to exposure settings for this image, the camera was set up to expose correctly (using the cameras onboard light meter).
Picture Sequence – 3c
One ‘f-stop’ above normal exposure
Comments – Finally looking at the ‘Over Exposed’ image we can see that it is merely an extension of parameters from the two previous sequences and we see that pixel data has been moved further to the right of the histogram. Unlike the picture sequences shown in images 1 and 2 we can see that a ‘Low Contrast’ picture remains very consistent throughout the histogram spectrum when introducing both ‘Under’ and ‘Over’ exposure characteristics. With regards to exposure settings for this image, the camera was set up to expose correctly (using the cameras onboard light meter).
What have I learnt from this exercise
I have learnt from this exercise more than I initially thought I would. I have always referred to the cameras histogram whilst taking pictures and with greater respect the RAW histogram whilst performing edits, especially the highlight clipping feature upon opening an image and adding gain to an exposure. I also never knew that the computer histogram (software derived) is visually different from the on camera variant. It has also been a worth while exercise for me to learn and better understanding the different types of histogram characteristics in relation to the different types of picture, as in Low, Normal & High contrasting images.
Below I have added some more information in relevance of histograms and their functions within the world of digital photography.
Picture – 4
What is a histogram
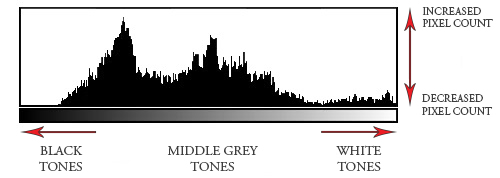
Comments – This diagram shows us the bare bones of what data a histogram tells us when reading an electronic image. In this example we can see that as tonal values change from ‘Blacks’ to ‘Greys’ and finally to ‘Whites’ the amplitude of tone resolution is captured and represented by increased and decreased pixel count.
Picture – 5
High key example
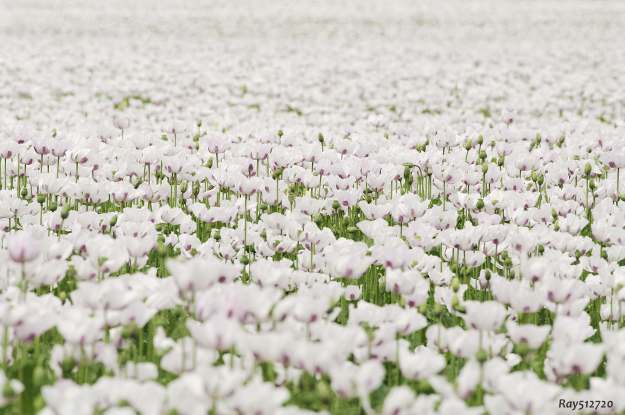
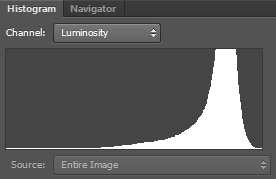
Comments – In this ‘High key’ picture we can again use the histogram to gauge our effective amount of exposure needed in its creation. In this case looking at the image’s histogram we can see the data is very much to the right hand side of the histogram and also that the captured picture has lost a large amount of information at the top end of the pixel spectrum due to over exposure.
Picture – 6
Low key example
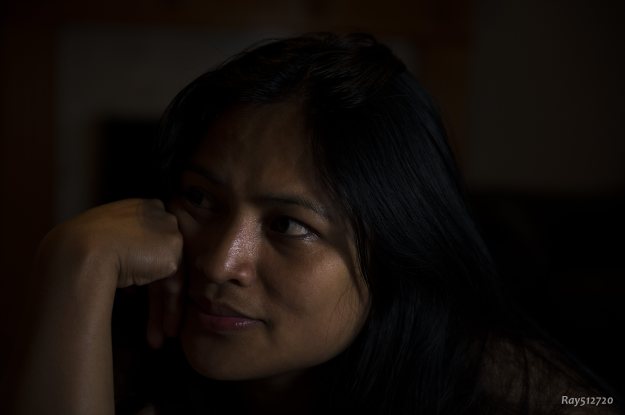
Comments – In the same way as we gauged a ‘High key’ exposure we can also gauge a ‘Low key’ exposure and in this histogram we see the image has lost data to the left of the histogram.
Thoughts and Reflection
Using the histogram as a tool rather than just a visual measuring aid of pixels and tones can be valuable in other types of photography as I have indicated above. In relevance of ‘High key’ images we can use the histogram as a tool to gauge how much ‘High key’ we want against how much pixel data the camera has electronically captured. In the images above we can see the increased and decreased pixel count across the spectrum of each pictures histogram and in both instances the data captured has gone beyond the range of the cameras sensor in one form or another but by using the histogram as a tool we can more effectively gauge how much exposure to add or decrease according to the camera sensors dynamic range.
Summary
I have enjoyed this exercise and with regards to histograms I now look at them with greater respect. Both my cameras have been fully calibrated to my Lightmeters performance which has really paid dividends to exposure performance but to ignore the value of the histogram is a trial and error and not to mention a lazy approach to photography. It’s a cameras tool that’s there to be used … so use it.
For further information on histograms the web link shown below has very good examples and explains further uses and issues outside the requirements of this coursework question. For my own reference I have printed the information from this site and included it into my DPP journal.


